Behavioural Based Clustering
- My Role
- Lead Experience Designer
- Timeline
- Q3–Q4 2024
- Key Metric
- 1
- Session to configure
Core challenge
Retail & Supply Chain · Enterprise SaaS
At a glance
Final solution at a glance
1
Session to configure
2
Product lines adopted
0
Silent publish failures
How do you let a business analyst define the rules of a machine — without becoming a machine themselves?
Retail buyers manage thousands of store locations across diverse geographies. Grouping these stores into meaningful performance segments — then acting on those segments with tailored assortments, pricing, and allocation decisions — is one of supply chain planning's most consequential, and most manual, problems. The existing tool provided only static rule-based segmentation. Analysts needed a way to configure behavioural, data-driven clustering models without engineering dependency, and without losing audit trail or reproducibility.
01 — The Problem
Three challenges that blocked effective segmentation.
Configuration Complexity
Analysts had no interface to define segmentation logic; every new cluster type required a dev sprint.
Model Opacity
Outputs from clustering algorithms were treated as black boxes; users couldn't interrogate or validate groupings.
Reassignment Friction
When results didn't match business expectations, there was no structured way to override cluster assignments at the store level.
02 — Design Principles
Four principles that guided every interaction.
The segmentation workflow was built on deliberate design principles — each one a response to a specific failure in the existing tooling.
Progressive Disclosure over Frontloaded Complexity
The configuration wizard splits actor setup into three tabs — Configuration, Segmentation Type, and Extension — so a planner can complete the minimum viable setup (name, service, type) before confronting algorithmic parameters like measure selection and grouping methods. Complexity is earned, not assumed.
System-Assisted, Human-Confirmed
For measure selection, the UI surfaces a multi-select dropdown with all available KPIs (Sales Units, Combined Performance Index, Shelf Capacity, etc.) rather than asking users to know the right ones. For feature selection in the clustering run, the system marks certain attributes as "Recommended" based on feature significance scores — the user still confirms, but the default is intelligent.
Reproducibility Through Explicit Configuration
Every actor stores its full parameter set — max cluster count, min/max stores per group, grouping method — as a named template. This actor becomes the "Segmentation Template" referenced when instantiating a new clustering activity. Any analyst can audit what parameters produced a given output.
Review Before Publish, Always
The clustering process enforces a 3-step workflow — Objectives → Review → Reassign → Publish. No output can be published without the analyst traversing the Review step, which surfaces both cluster distribution and attribute analysis. This is a deliberate forcing function against rubber-stamping system outputs.
03 — Workflow: Actor Configuration
Six steps to define a segmentation template.
The actor configuration wizard guides analysts from template creation through algorithmic parameterisation, ending with a named, publishable segmentation template ready for downstream activities.
Actor configuration flow: from template creation through algorithmic parameterisation to publishable segmentation template.
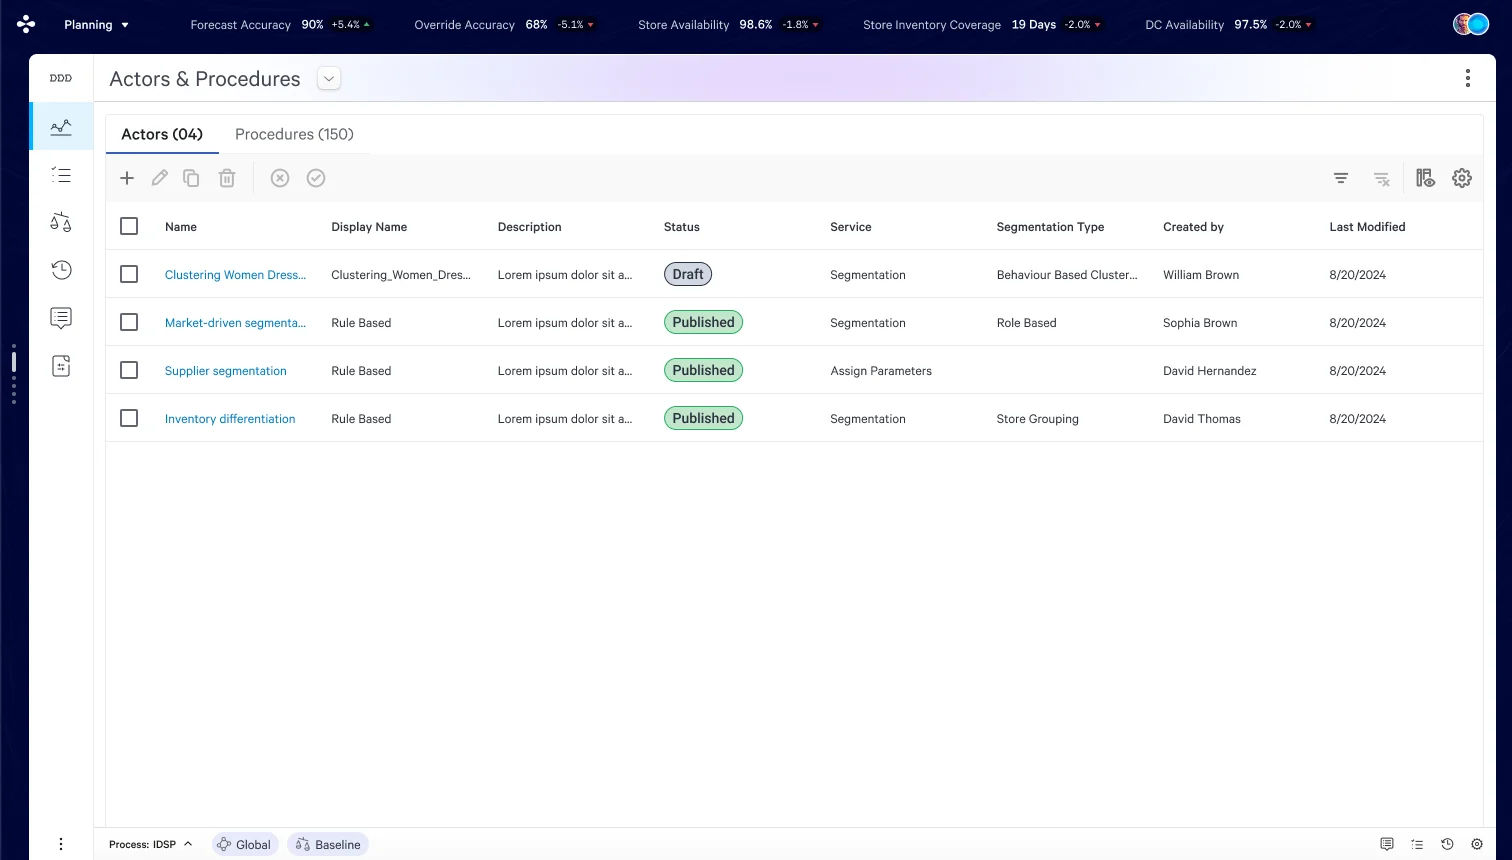
Entry point for all segmentation configuration. Status chips communicate lifecycle state at a glance — analysts know what is live without opening individual records.
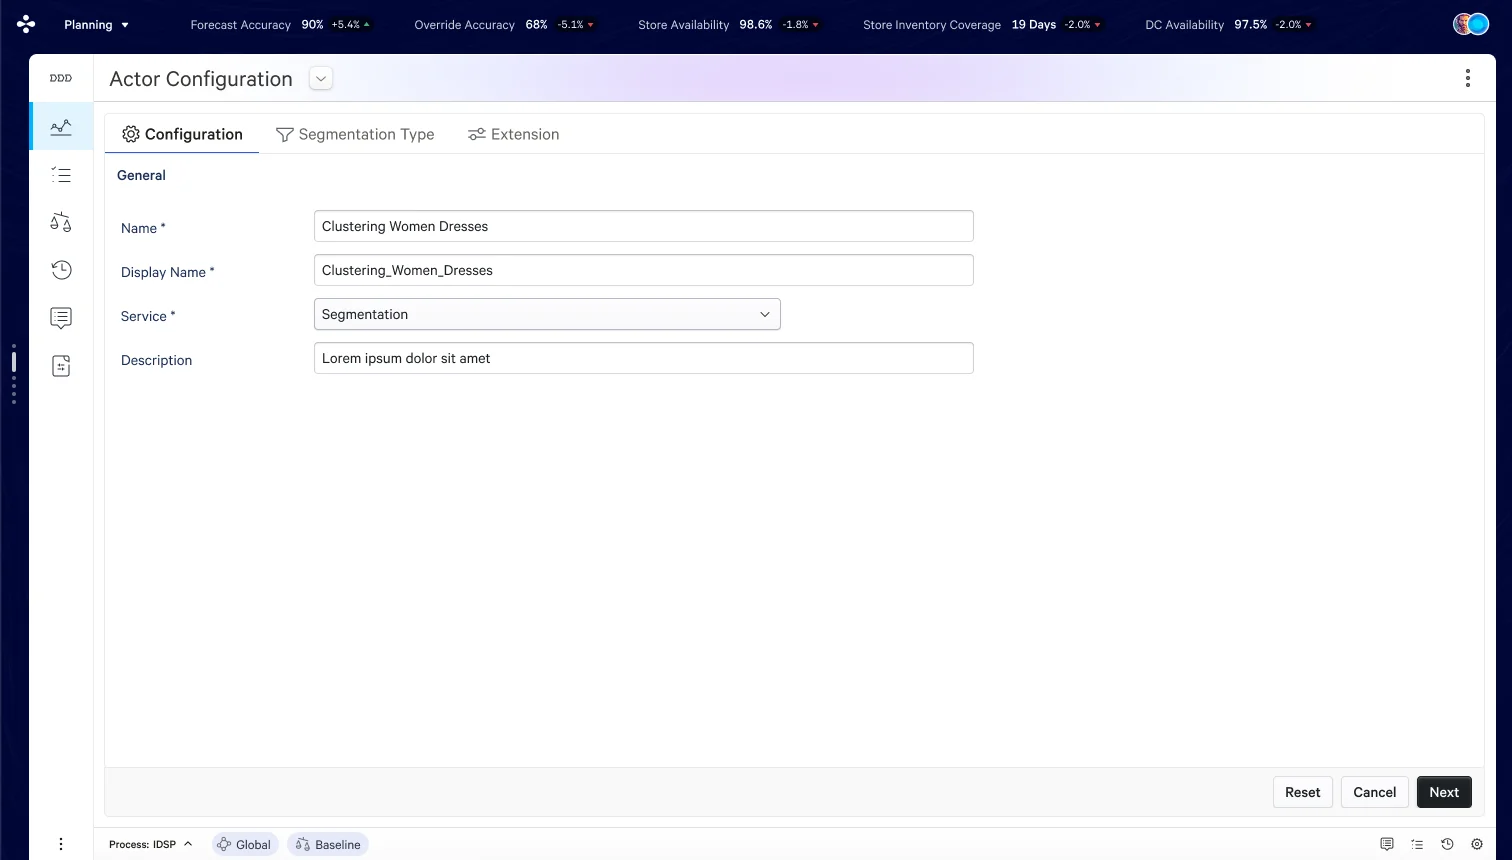
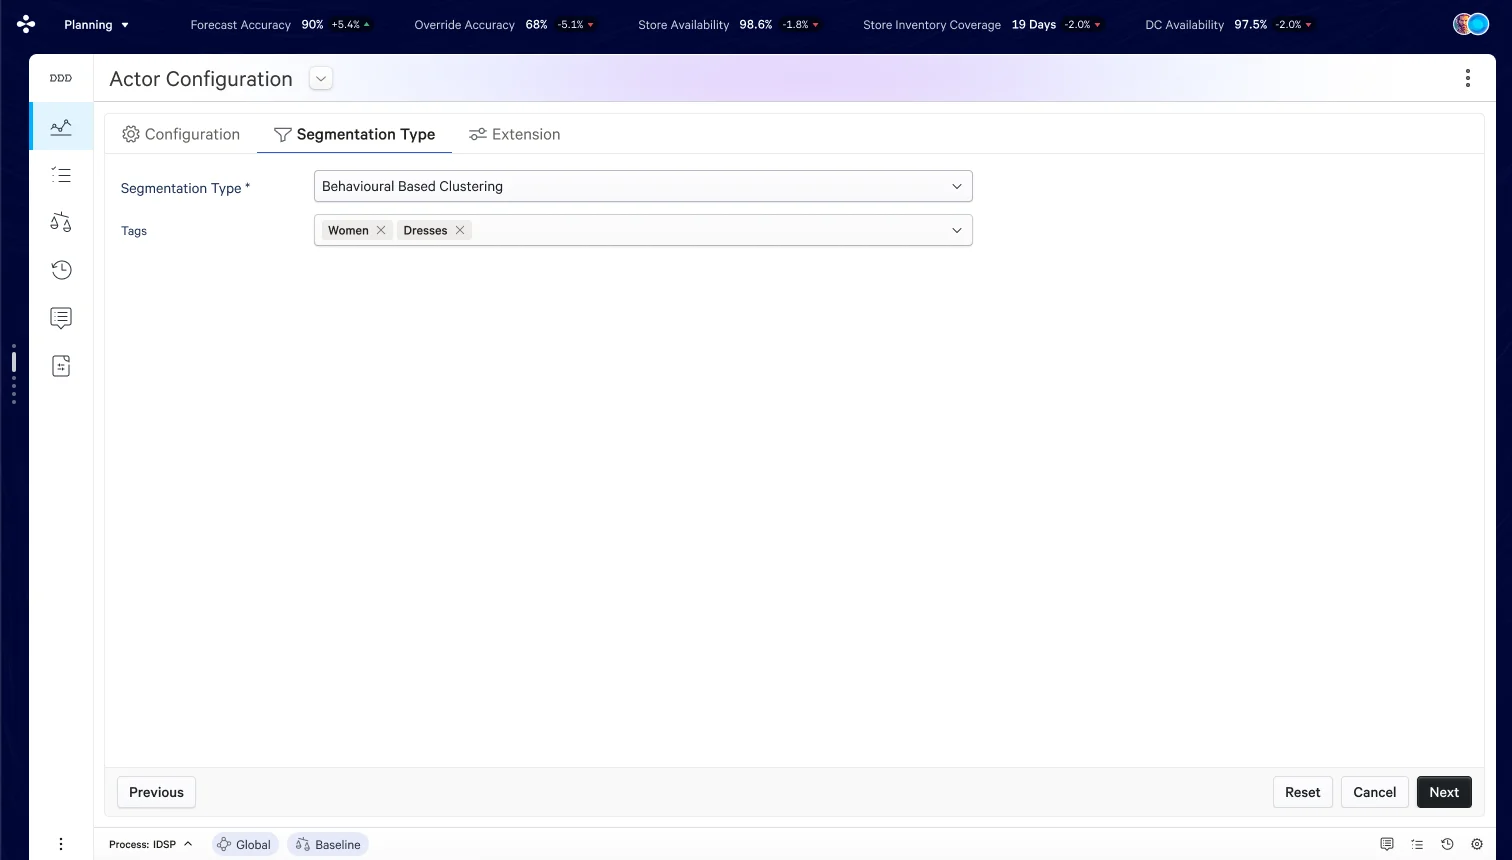
Tab 1 confirms configuration entries; Tab 2 declares segmentation scope via tags referenced during template matching.
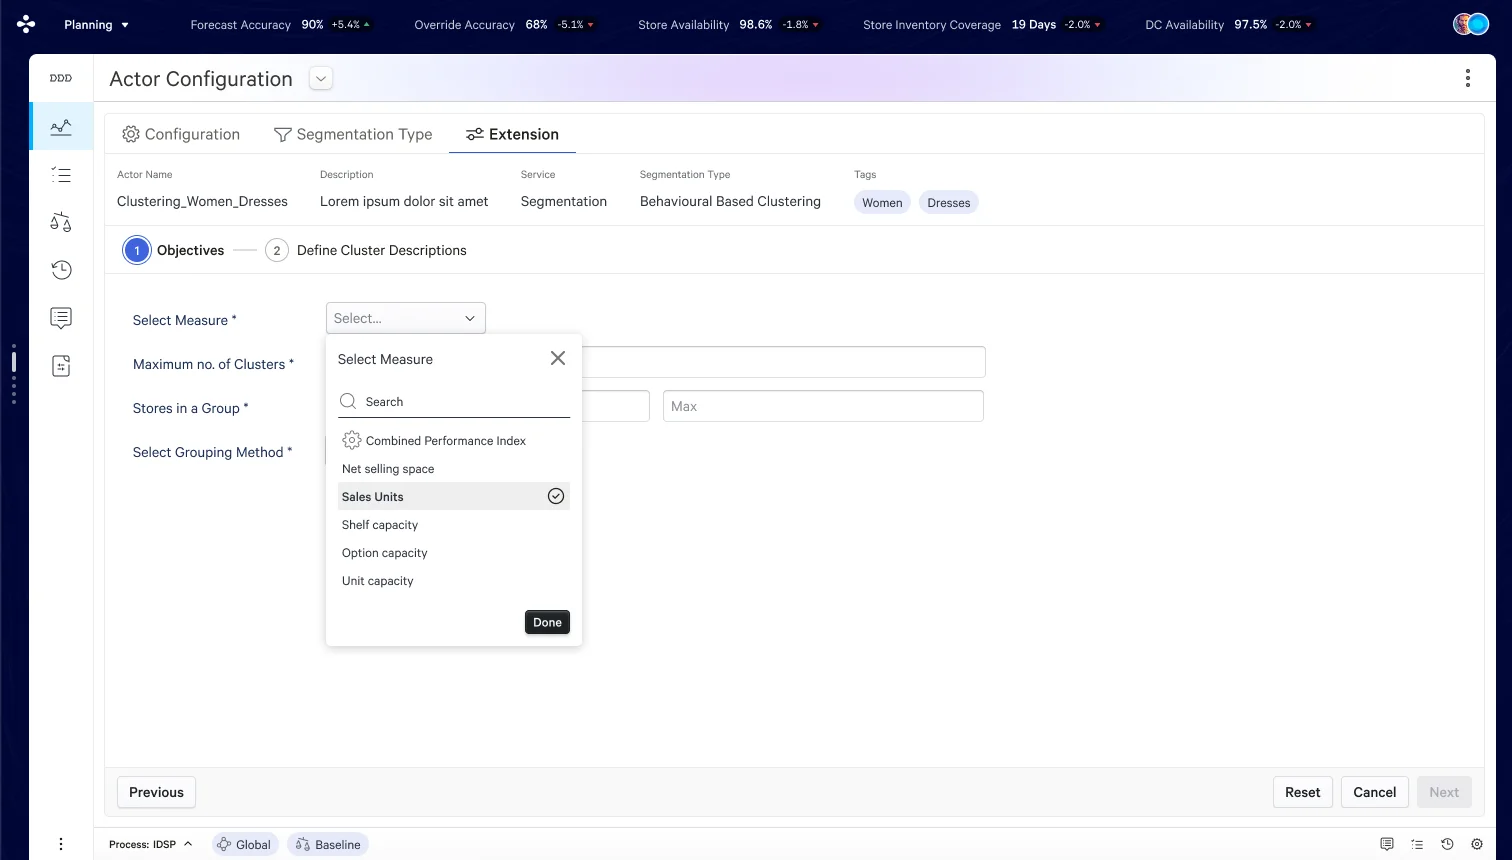
The system removes recall burden — analysts pick from a structured list rather than typing KPI names. Sales Units shown as selected; checkmark icon confirms active selection.
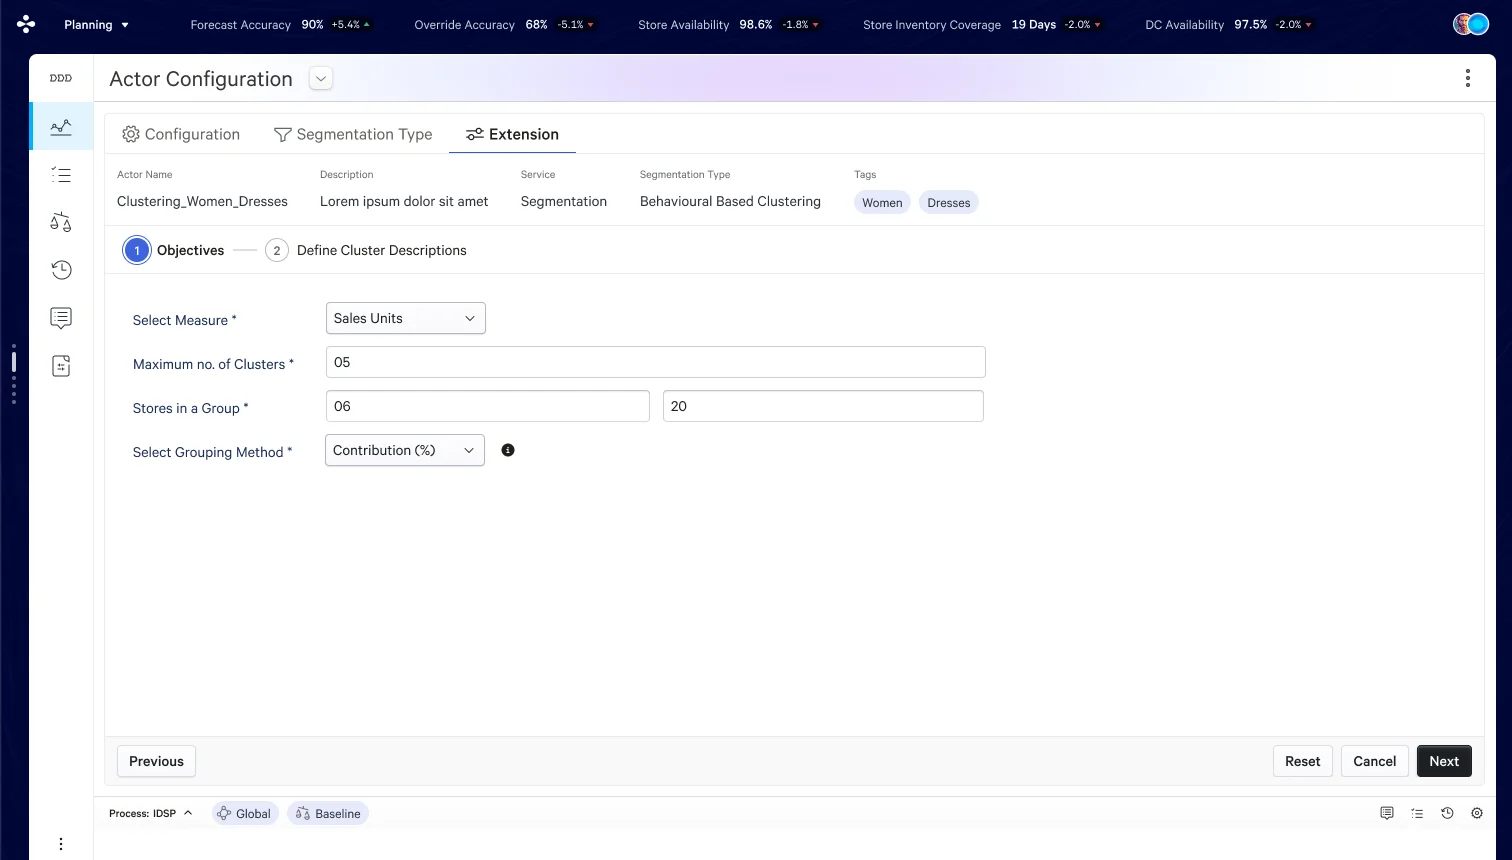
Four fields, all constrained inputs — no free text. Max Clusters and Store Range together define the algorithms solution space.
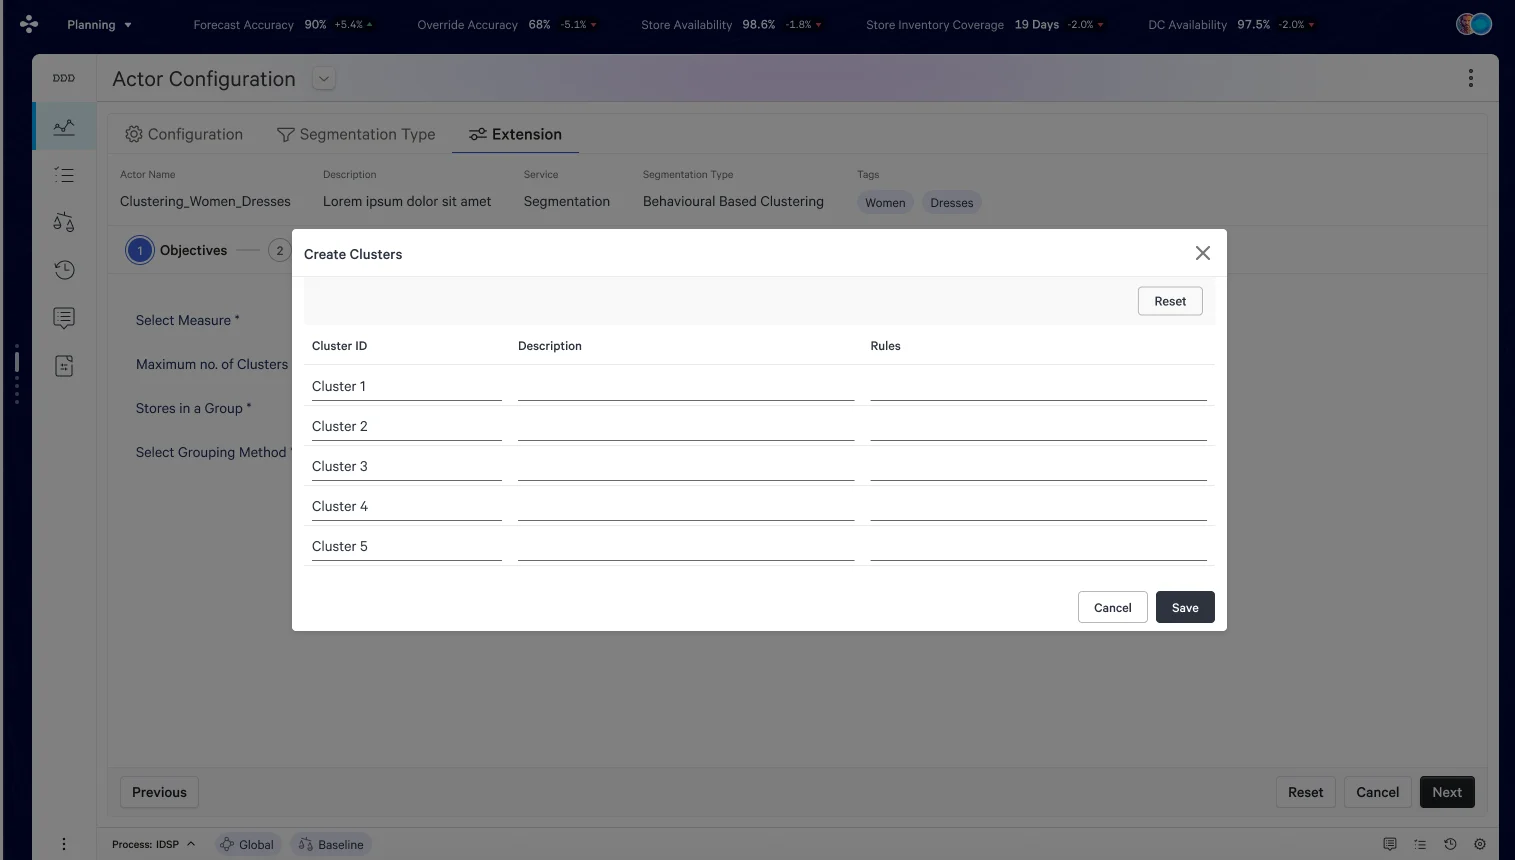
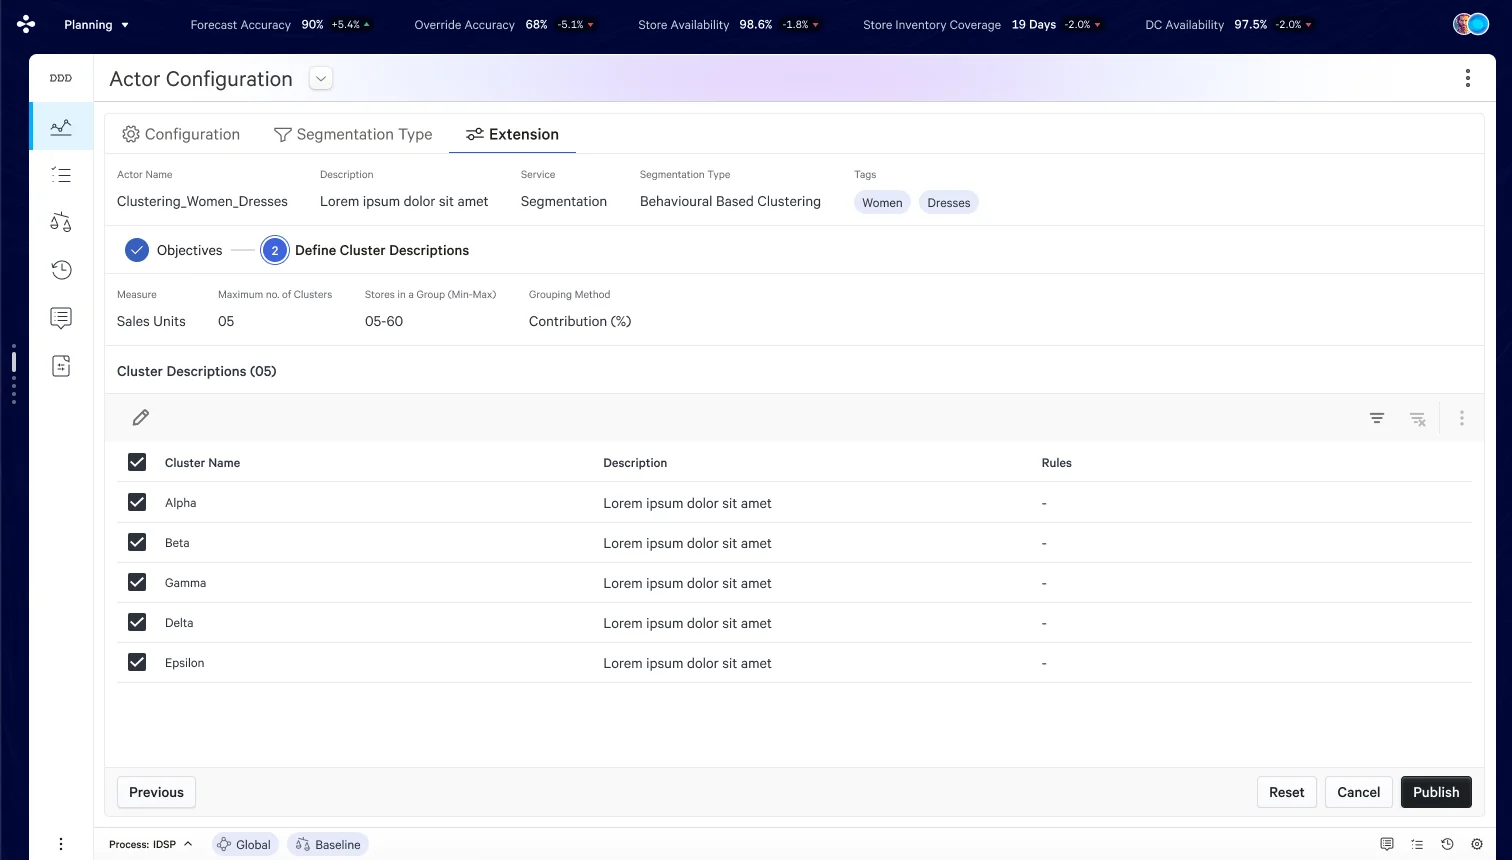
Left: cluster count matches the Max Clusters value — system scaffolds structure, analyst fills meaning. Right: Publish is the final gate — the actor becomes a reusable template available to all analysts in the planning environment.
04 — Workflow: Clustering Process
Three phases. From activity creation to published segments.
Once a segmentation template is published, analysts create activities that reference it — instantiating the configuration against real location and product scopes. The process breaks into three phases.
Creating a New Segmentation Activity
From the Segmentation Dashboard — a paginated list of 2,000+ activities with status chips (Ready, Review, Processing, Published, Process Failed) — the analyst clicks "Create New." A modal collects Activity Name, Description, Start/End Dates, Segmentation Method, Segmentation Template (searchable dropdown), Location Scope, Product Scope, and Historical Date Range. The Template picker includes a preview mechanism — hovering an option surfaces a "Template Overview" panel showing Measure, Max Clusters, and the pre-defined cluster names. This allows the analyst to confirm the right configuration before committing.
Feature Selection & Running Clustering
The activity opens to a 3-step progress rail: Objectives → Review → Reassign. In the Objectives step, the system displays a feature selection table grouped by Dimension (Product, Location) and Attribute (Brand, Size, Color, Region, Store Size, Store Type, Age Group, Income Level). Each row shows Sales ($), Units, and Feature Significance (%). The system marks high-significance attributes as "Recommended." The analyst selects features — informed by the system's signal but not bound by it — then clicks "Run Clustering." A progress modal with a 50% progress bar and a "Hide" affordance allows the analyst to continue other work without blocking their session.
Review, Reassign & Publish
Post-run, the status transitions to "Review." The Review step has two primary views: Distribution tab (cluster-level stats: Stores count, % of Stores, % of Measures, Characteristics; plus store-level breakdown and a 3D scatter plot with optimal cluster count comparison) and Attribute Analysis tab (cross-cluster attribute matrix showing dominant pairs per cluster). The Reassign step has All Stores (flat list with per-store "Reassign To" dropdown) and Drift Analysis (cluster-to-cluster migration matrix comparing against a previous activity — the only tool contextualising results over time). After completing Reassign, the "Publish" CTA becomes available.
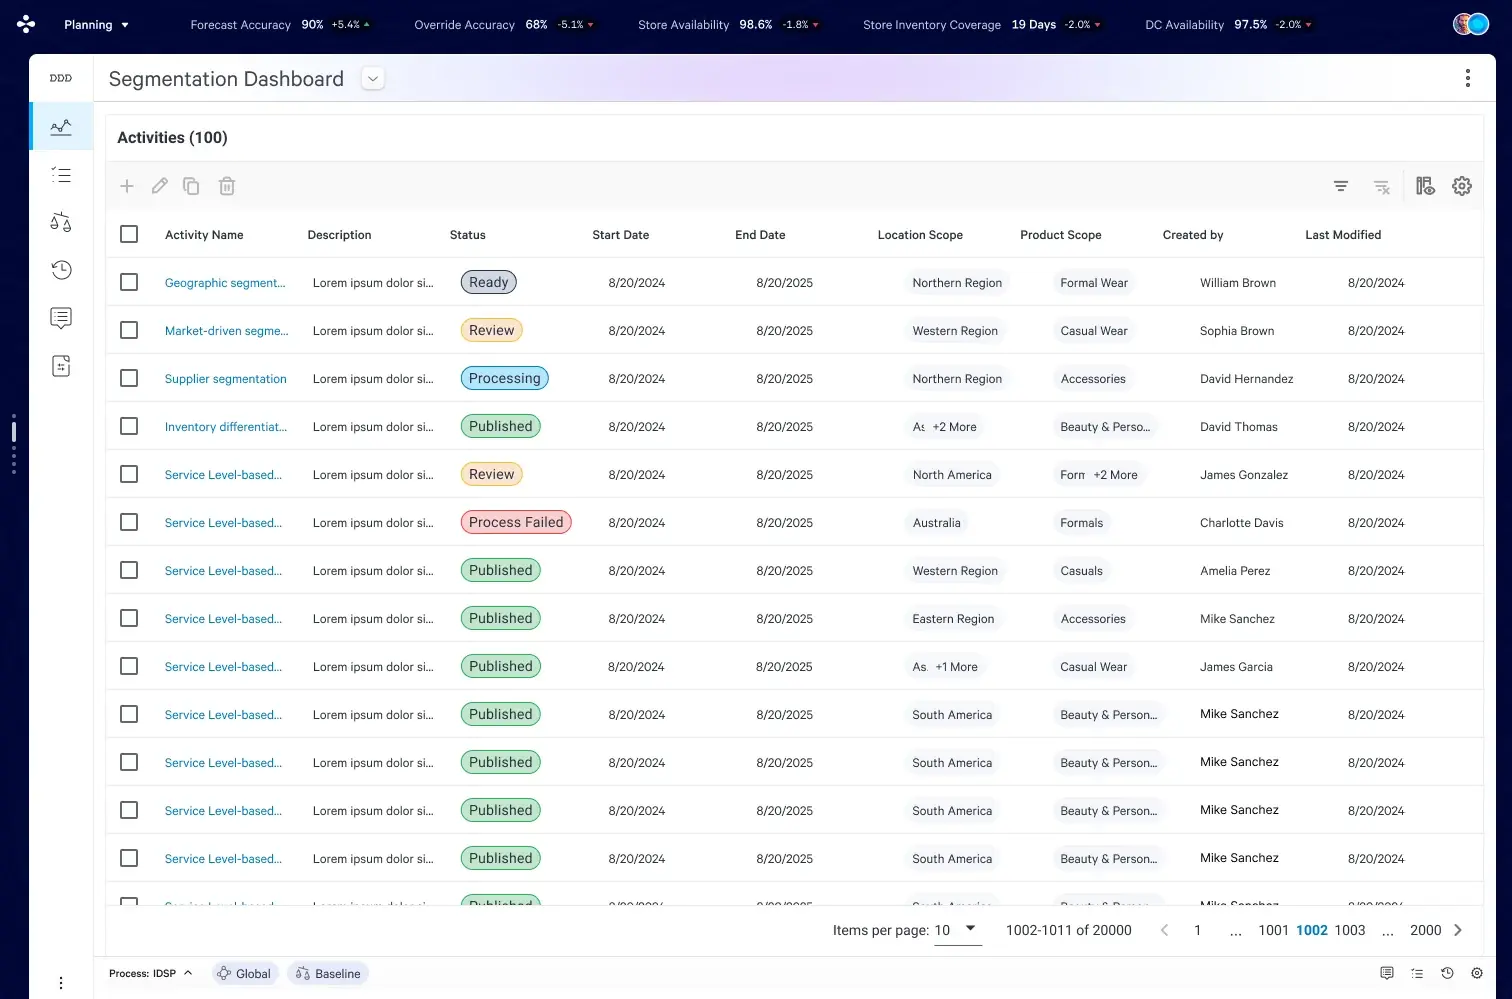
Scale signal: 2,000 activities across a single planning environment communicates the operational complexity this tool manages. Status variety (including "Process Failed") shows honest system states — not a sanitised demo.
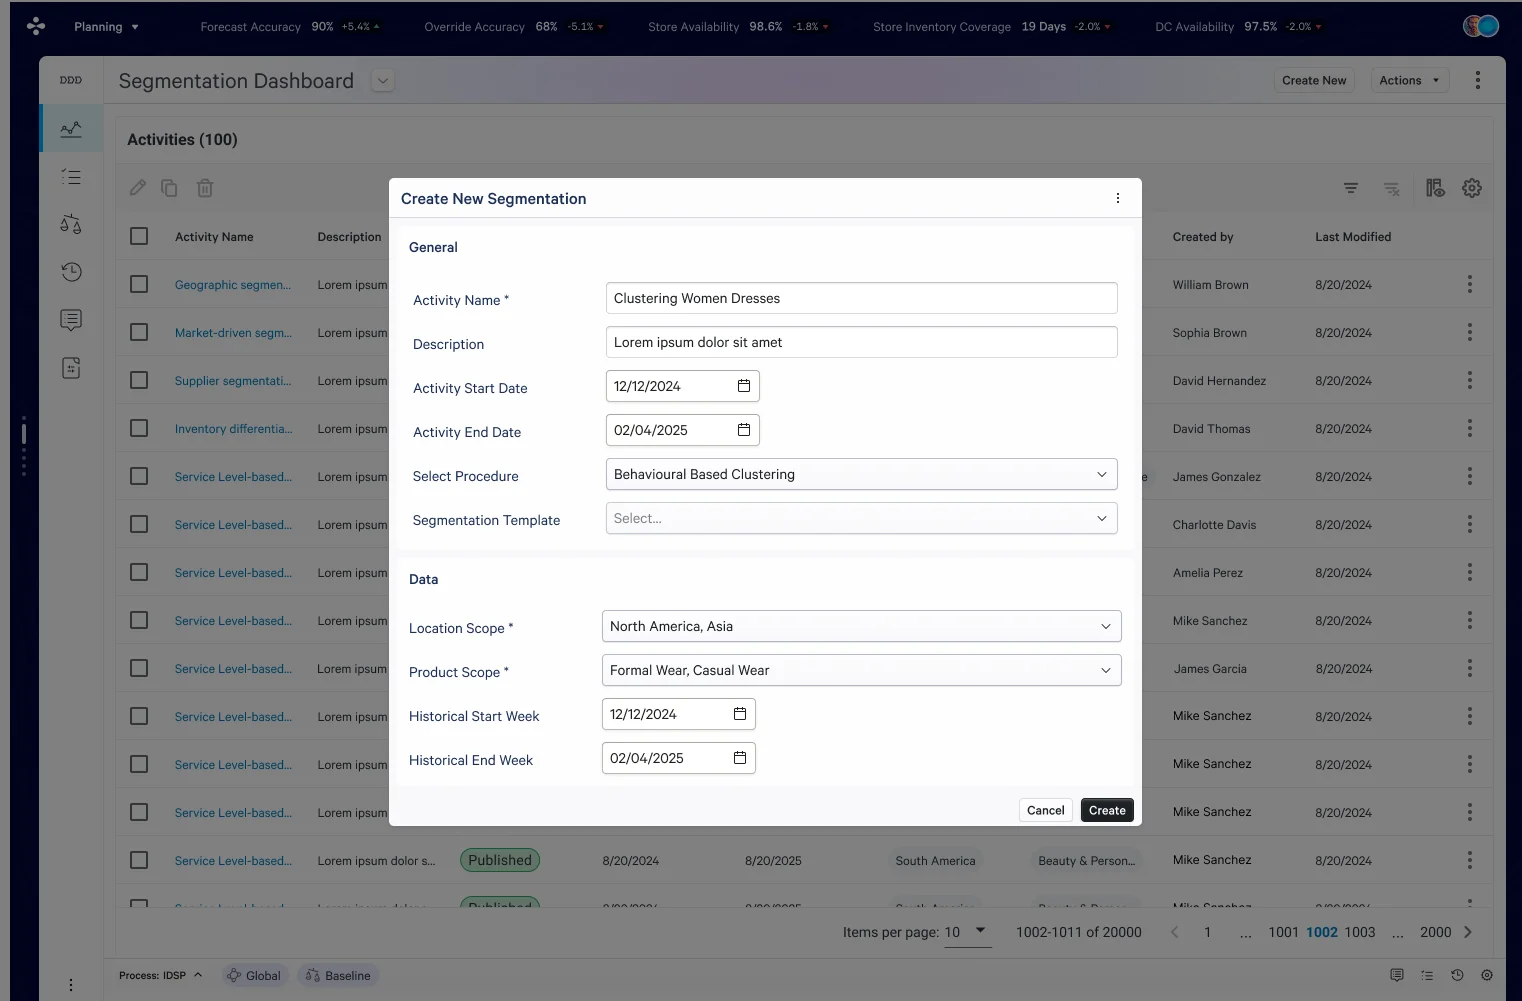
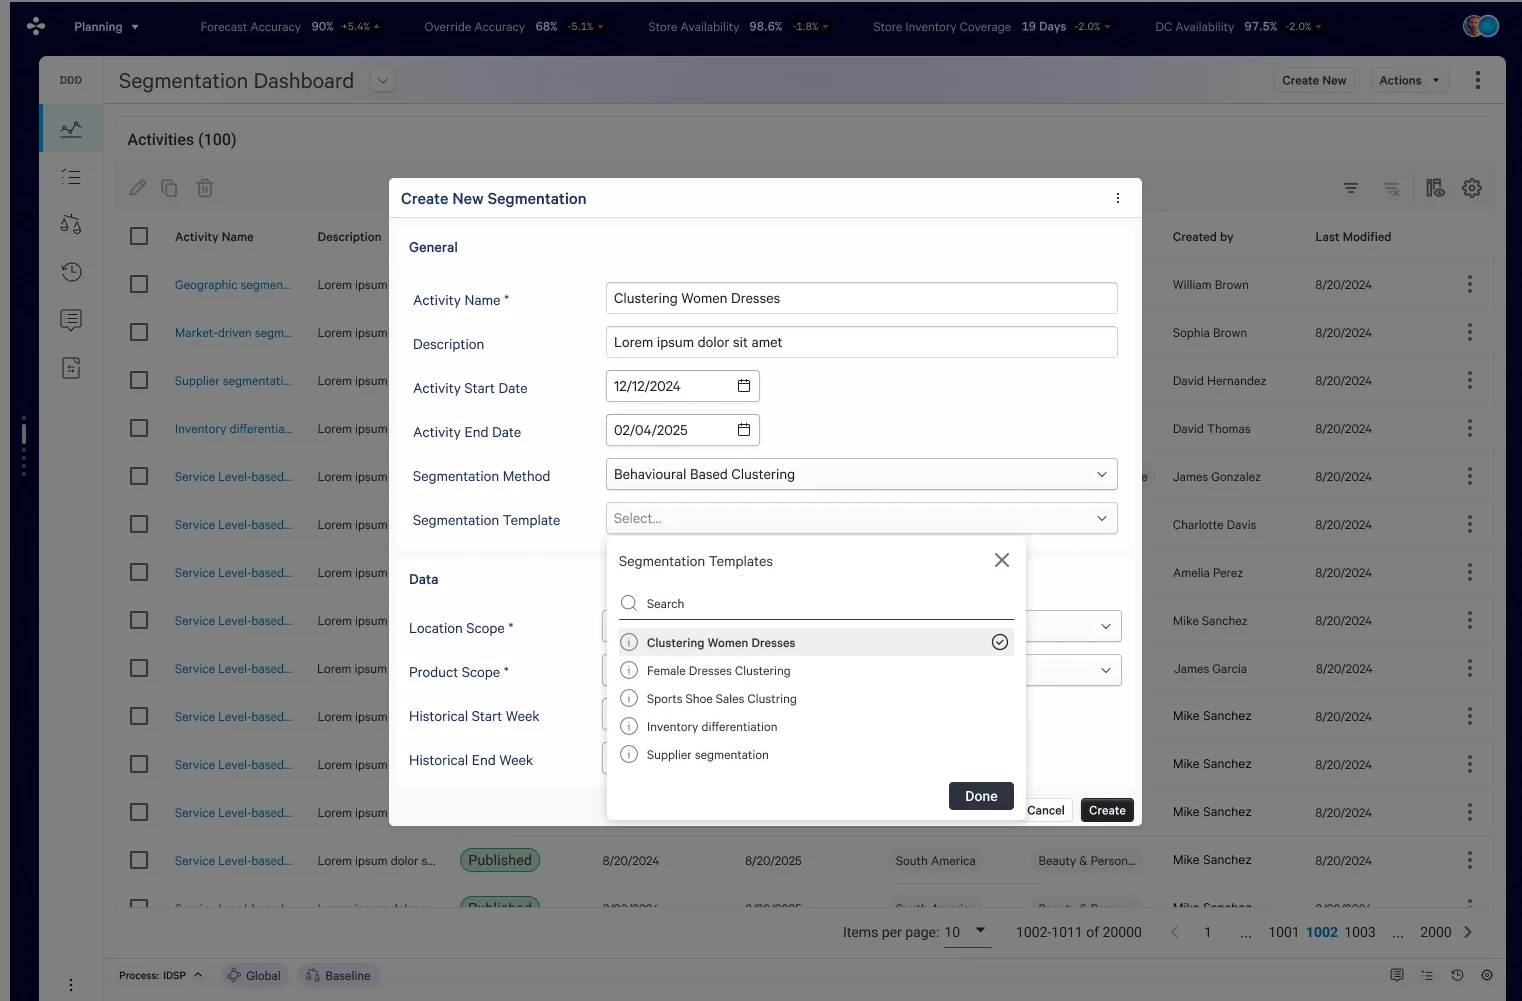
Two-section modal keeps analytical scope configuration visually separate from activity metadata. The Template picker is the downstream payoff of the Actor Configuration workflow — templates built by analysts are surfaced here as reusable configurations.
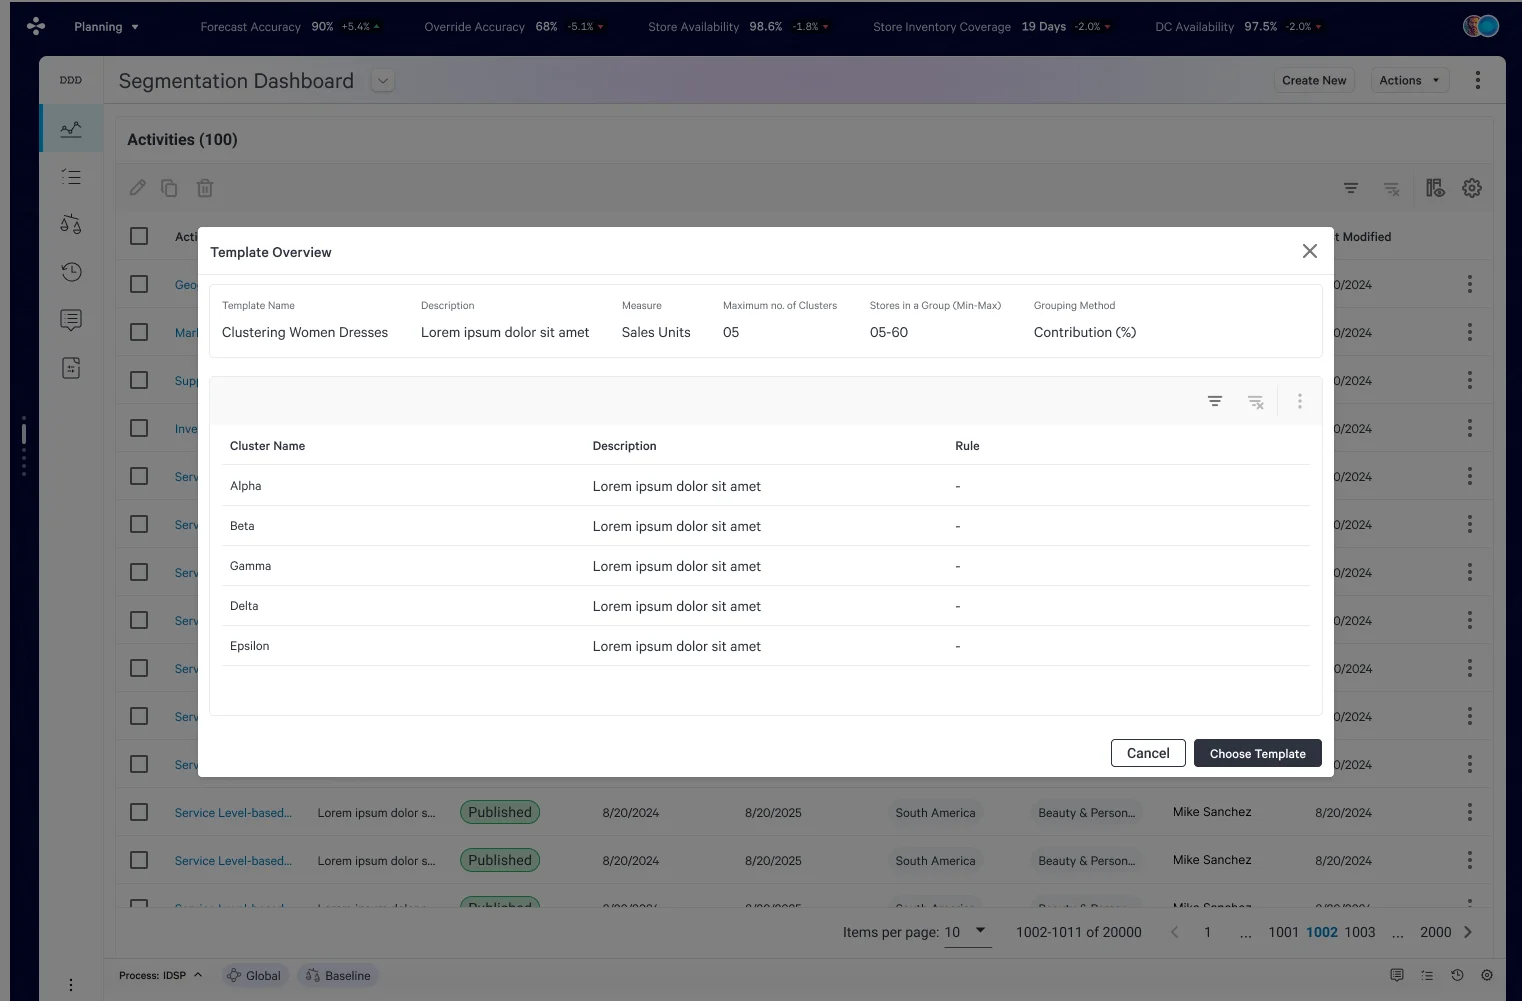
Pre-selection preview eliminates the "which template was that again?" problem. Analysts confirm the configuration lineage before the activity is created.
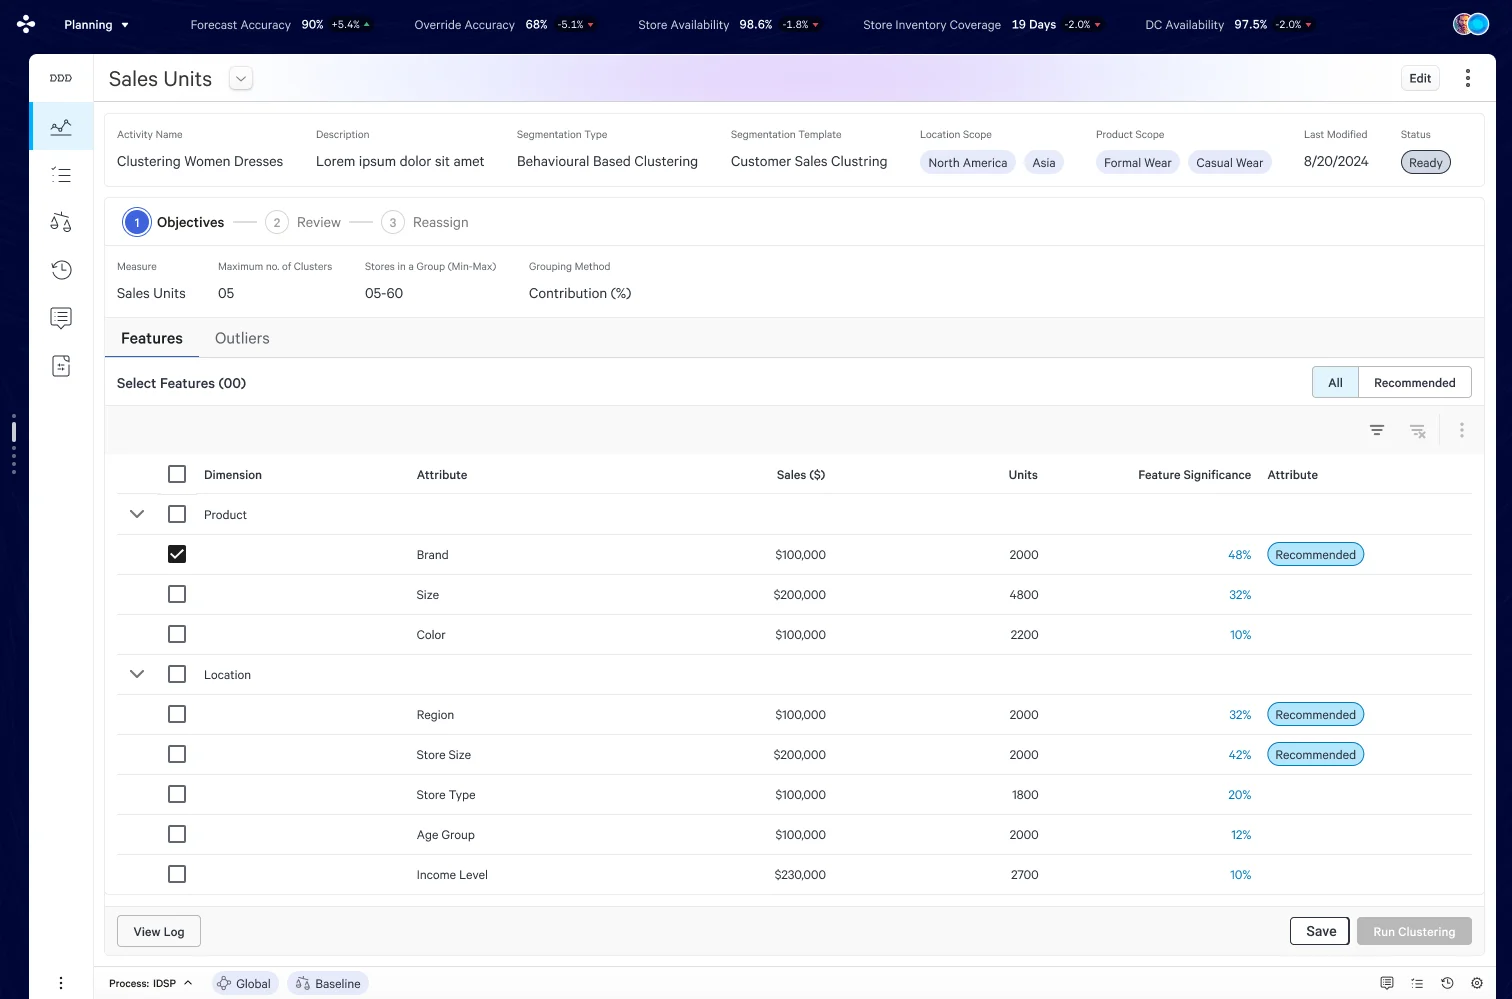
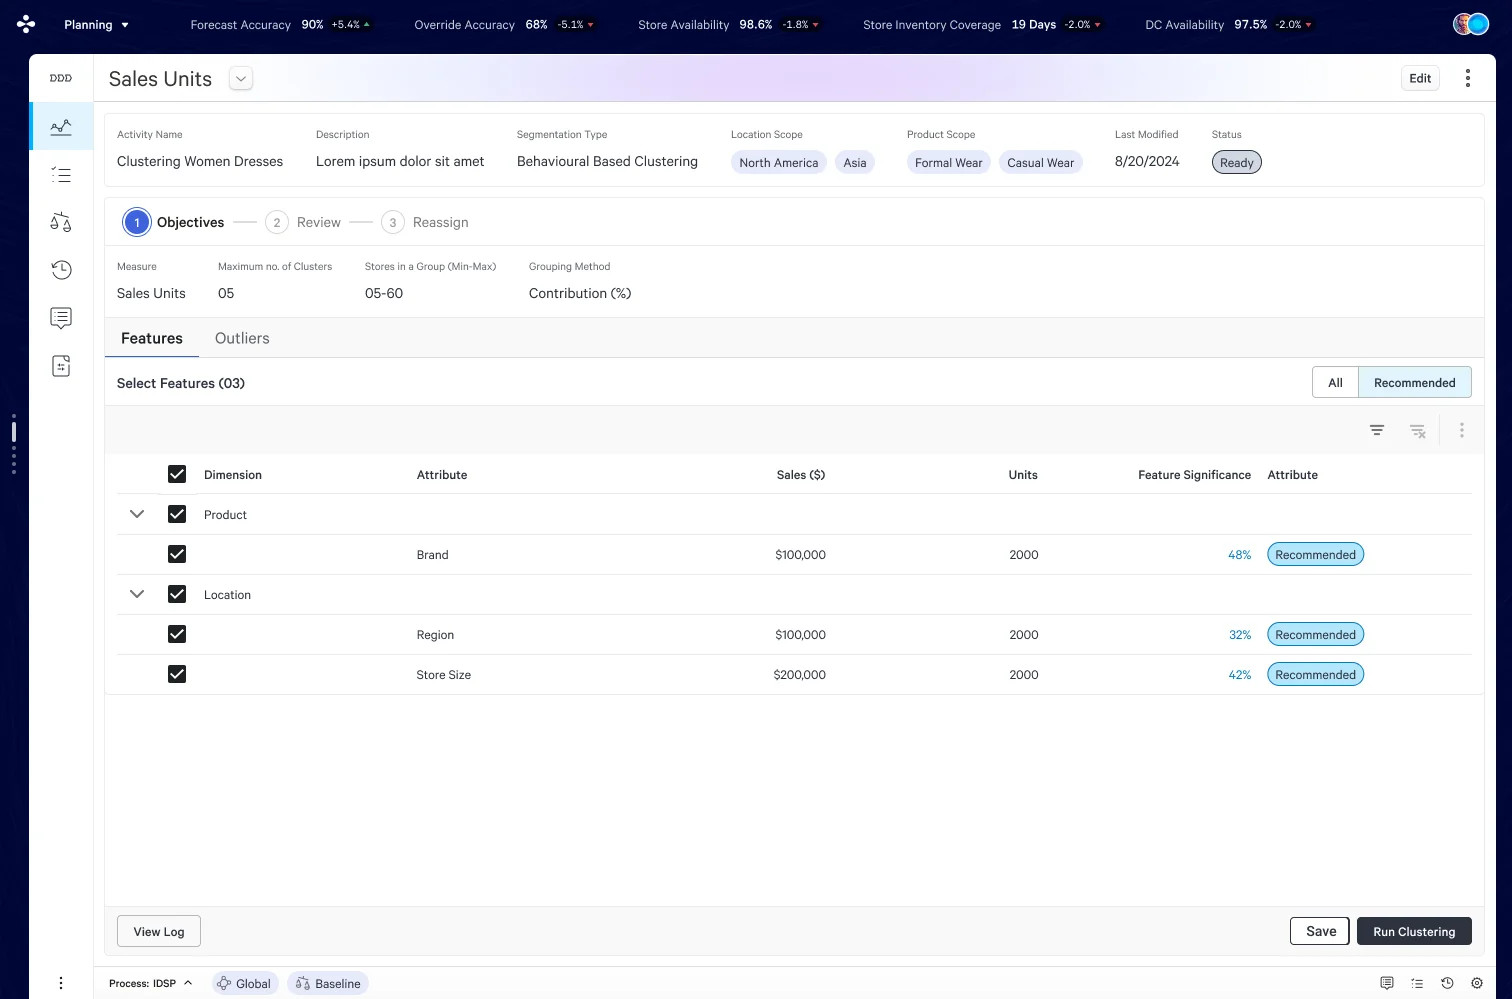
Recommended chips surface system intelligence without removing analyst agency. "Run Clustering" activates only once minimum required features are selected — a silent validation that prevents incomplete runs.
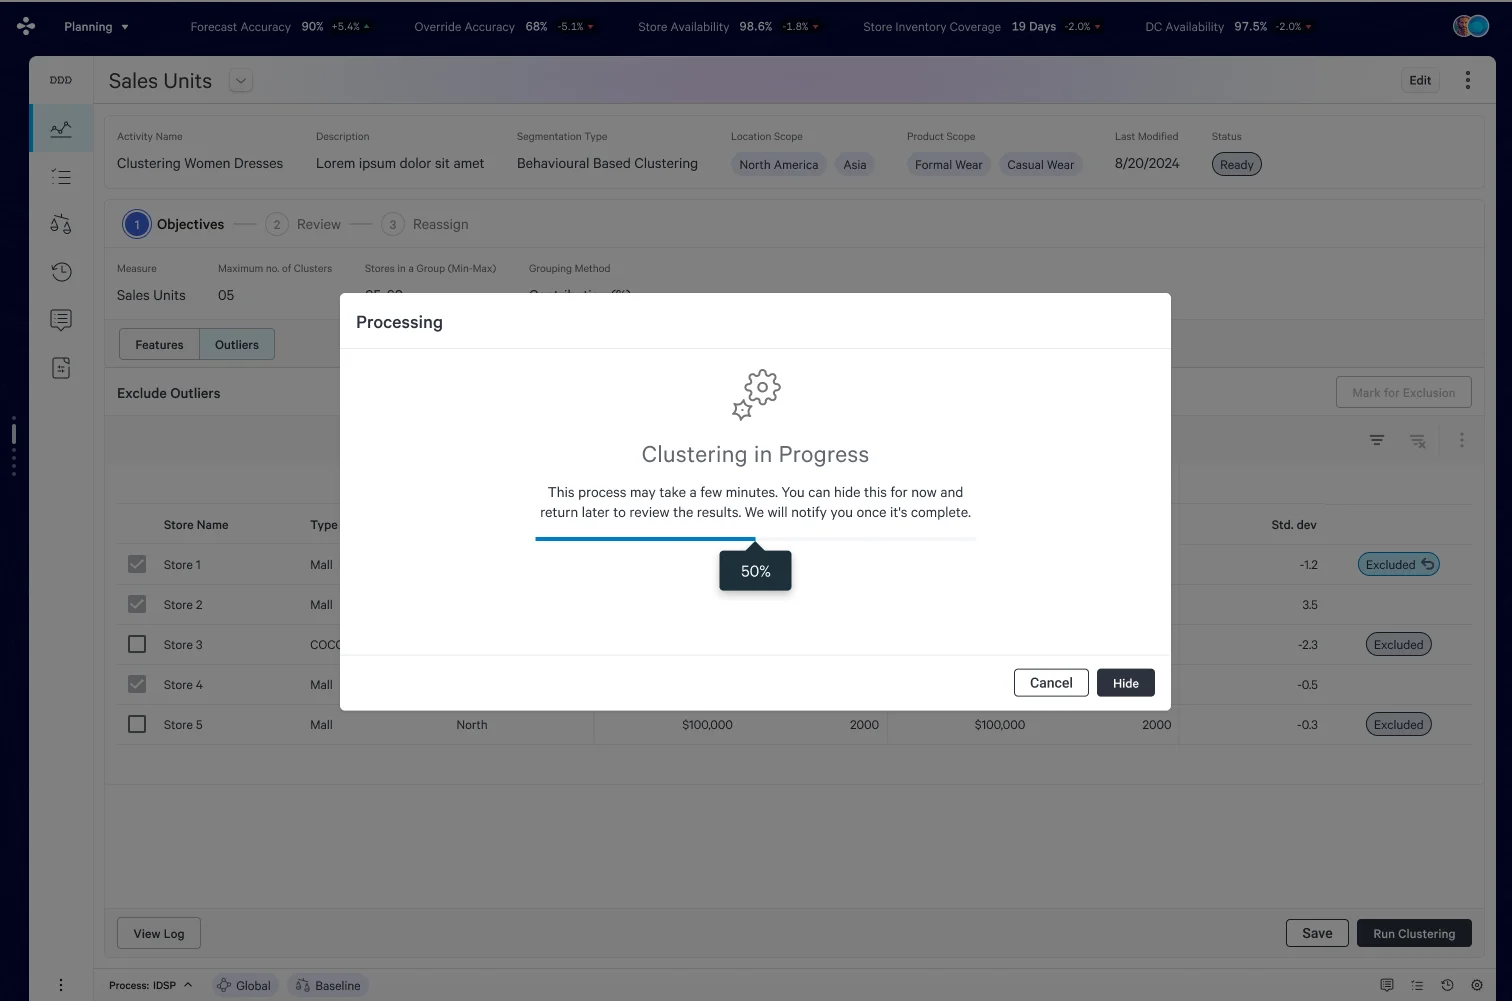
The "Hide" affordance is a deliberate non-blocking design choice — analysts working in a planning environment cannot be held hostage to a loading screen. The system takes responsibility for notifying on completion.
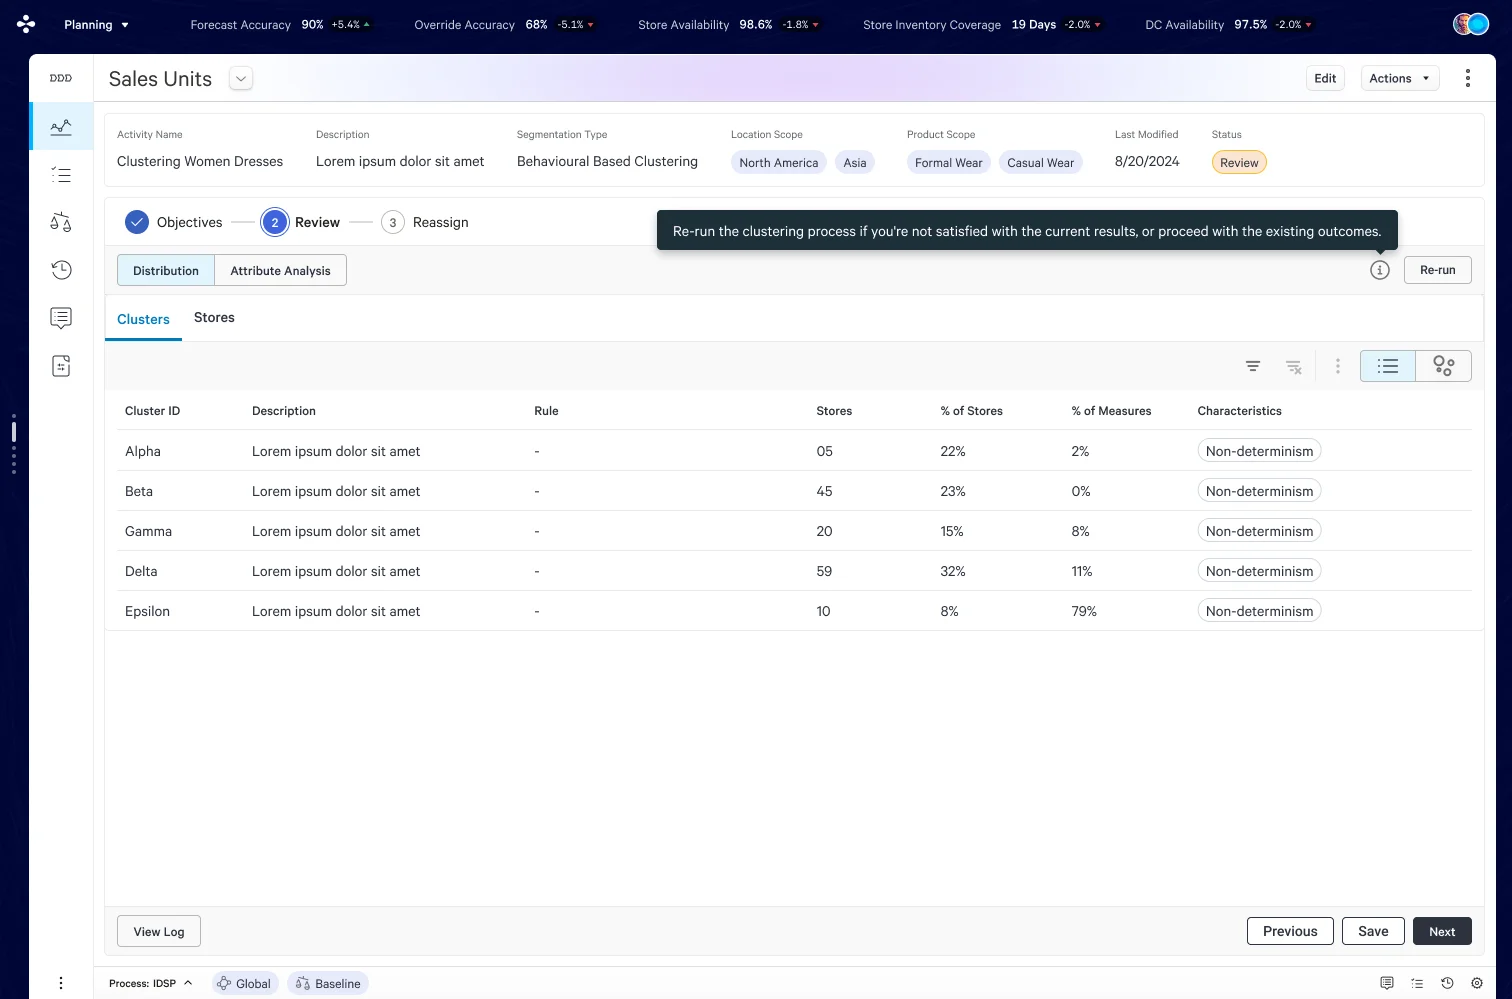
The Re-run CTA with its inline tooltip is a trust-building mechanism — it signals that the system is a collaborator, not a black box. Analysts can challenge results without losing their configuration.
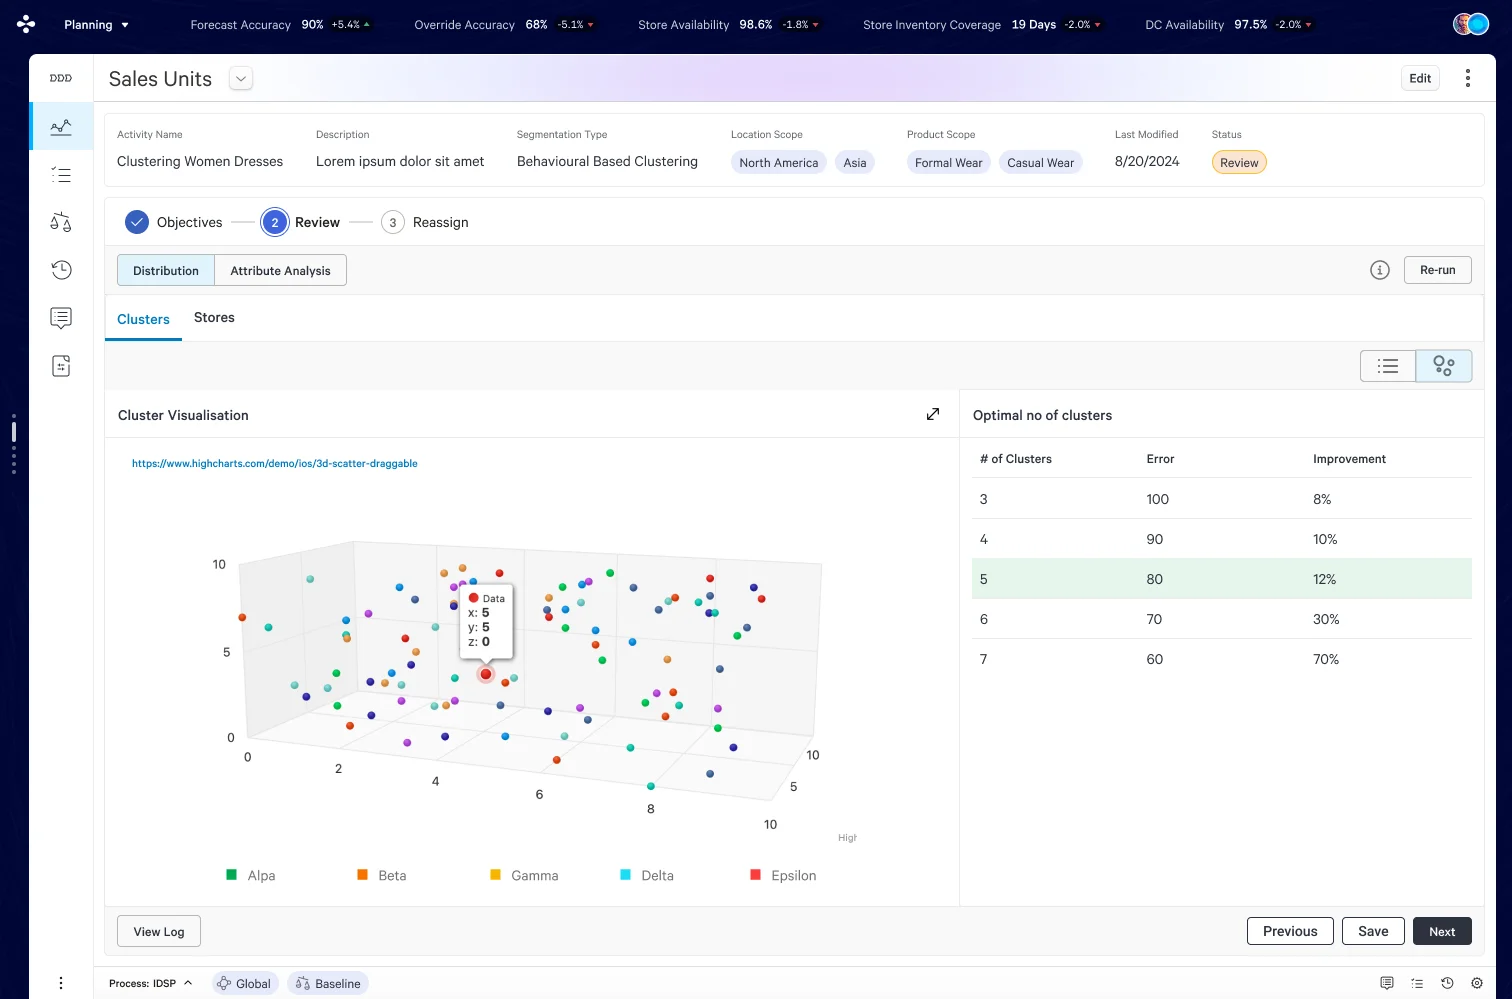
The scatter visualisation makes cluster separation tangible — analysts see whether groups are well-differentiated or overlapping. The Optimal Clusters table translates algorithm output into a business recommendation: 5 clusters yields 12% improvement over 4.
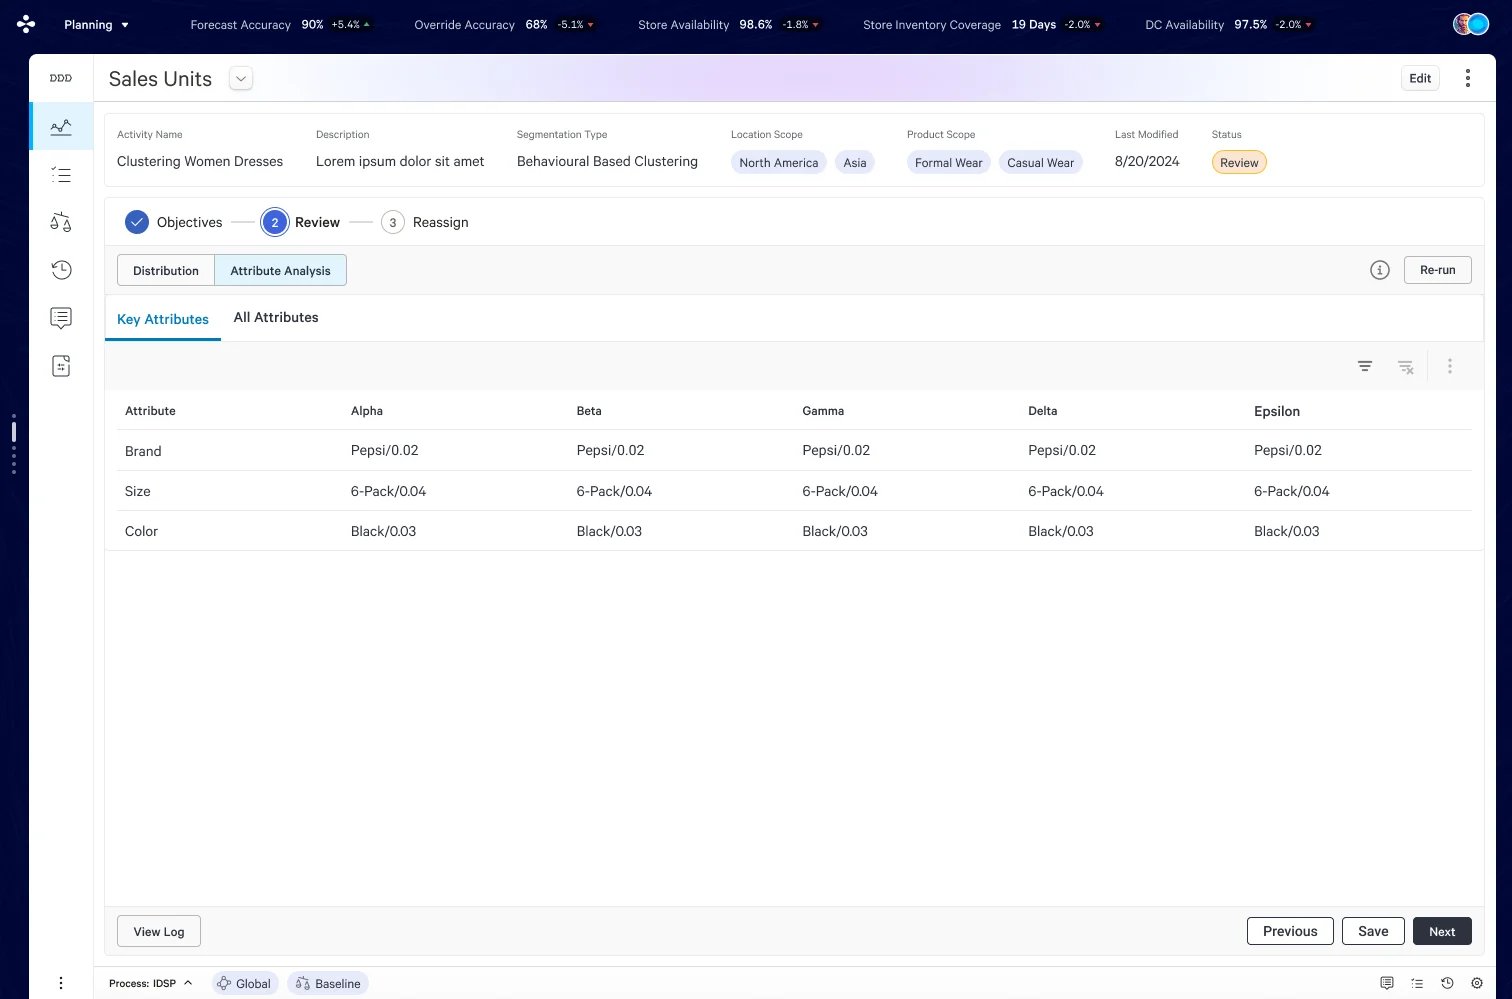
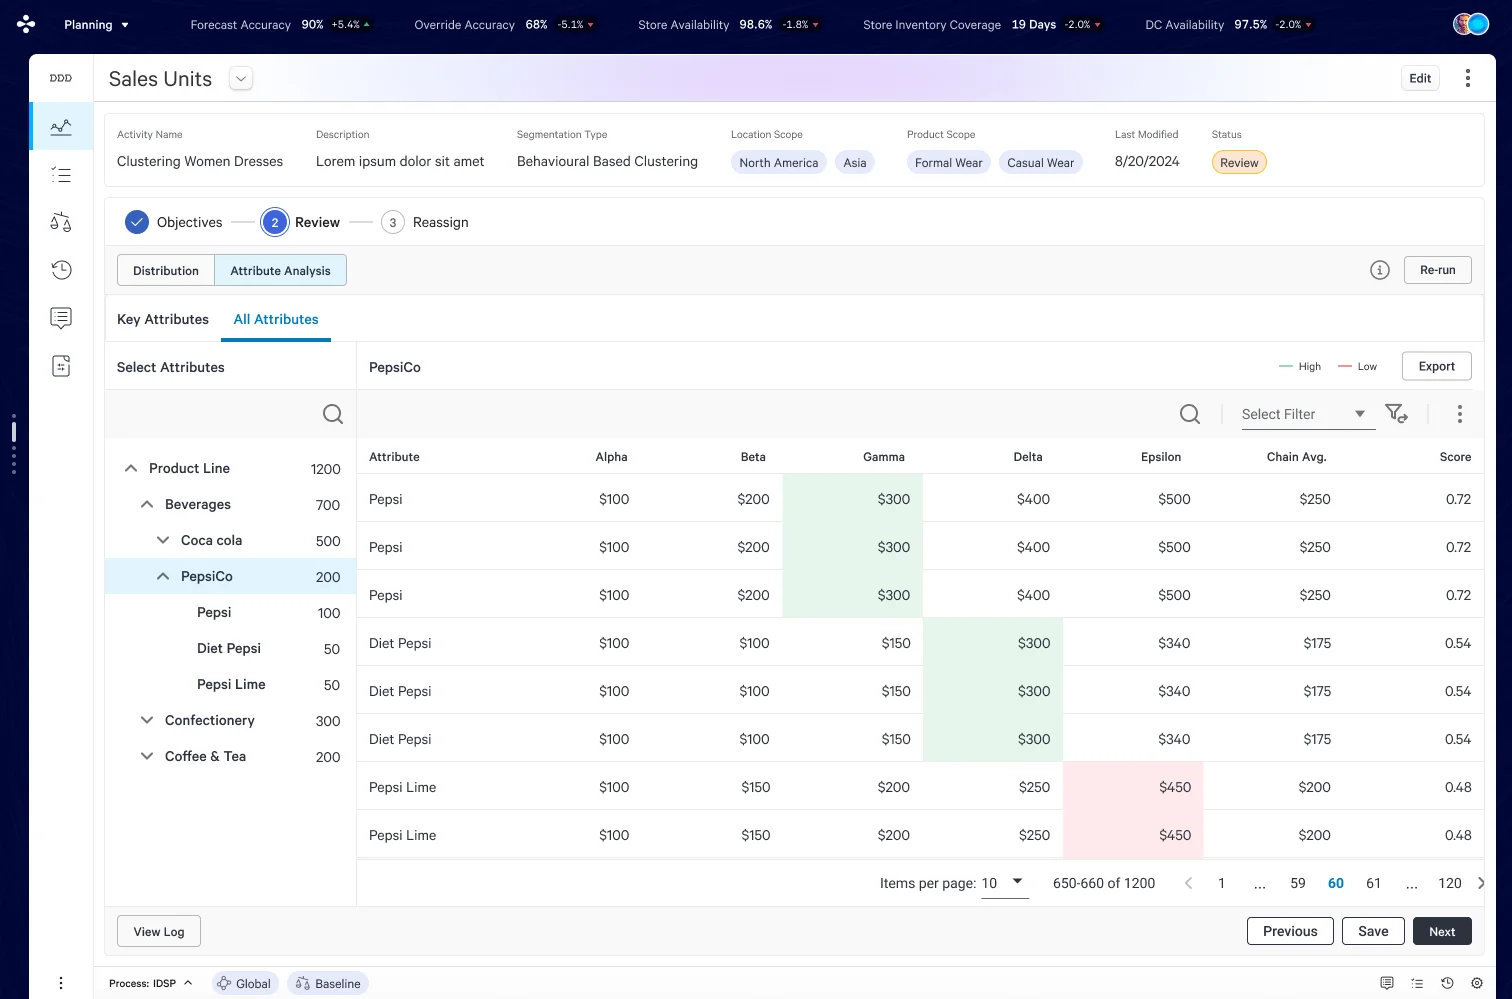
Compact cross-cluster comparison tells analysts what behavioural signature defines each group. The heatmap encoding reduces cognitive load — analysts identify performance outliers by colour before reading numbers.
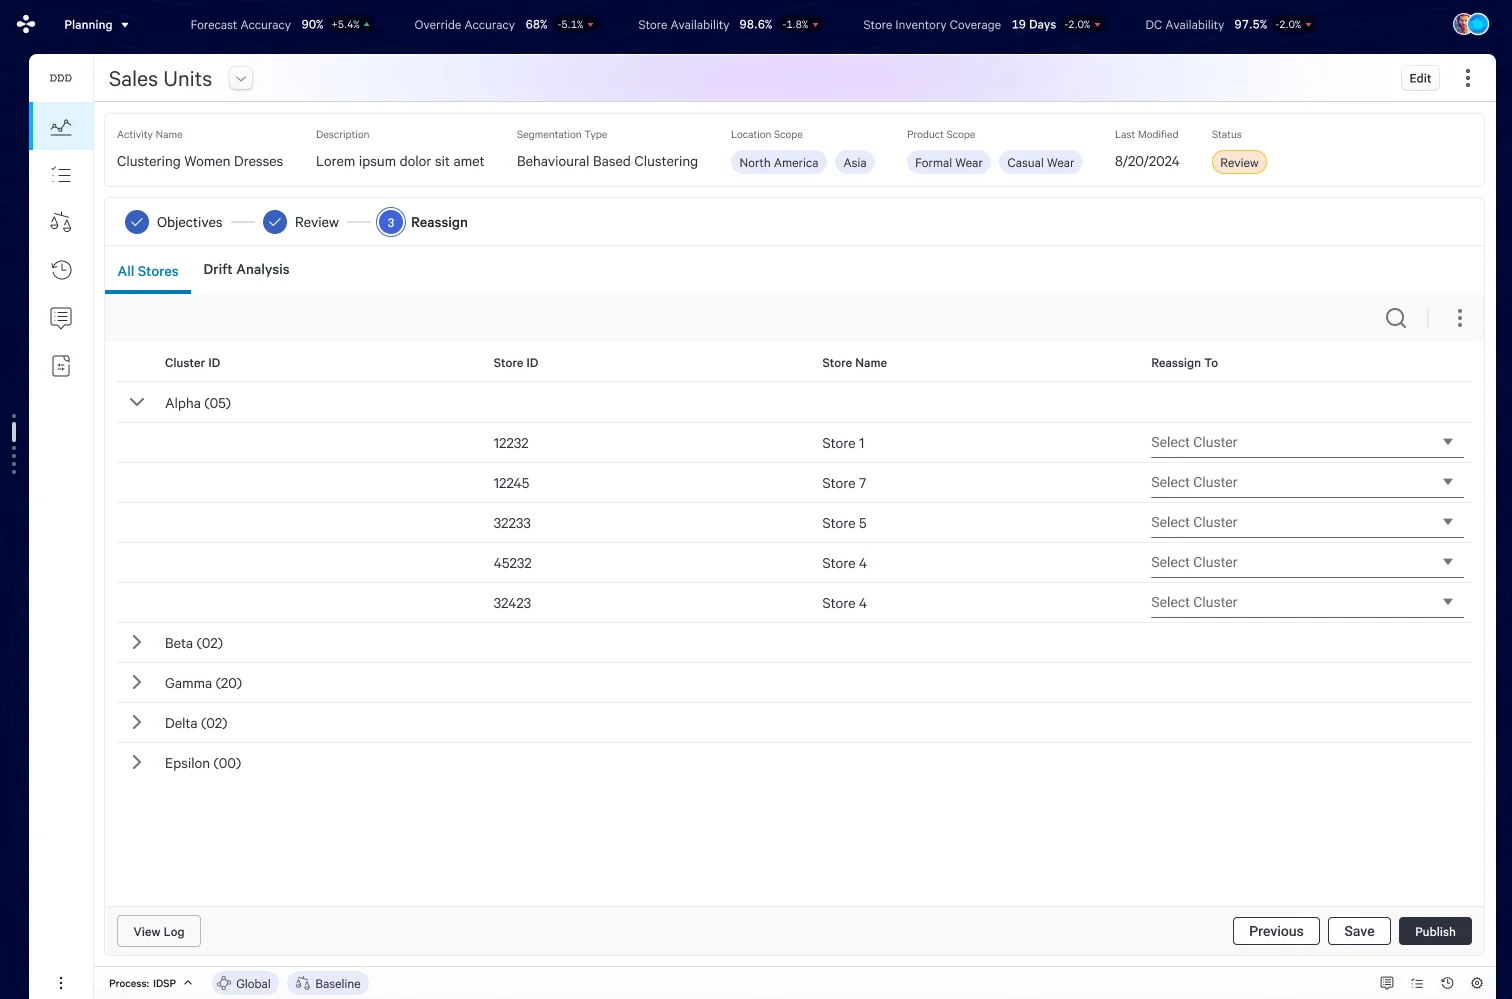
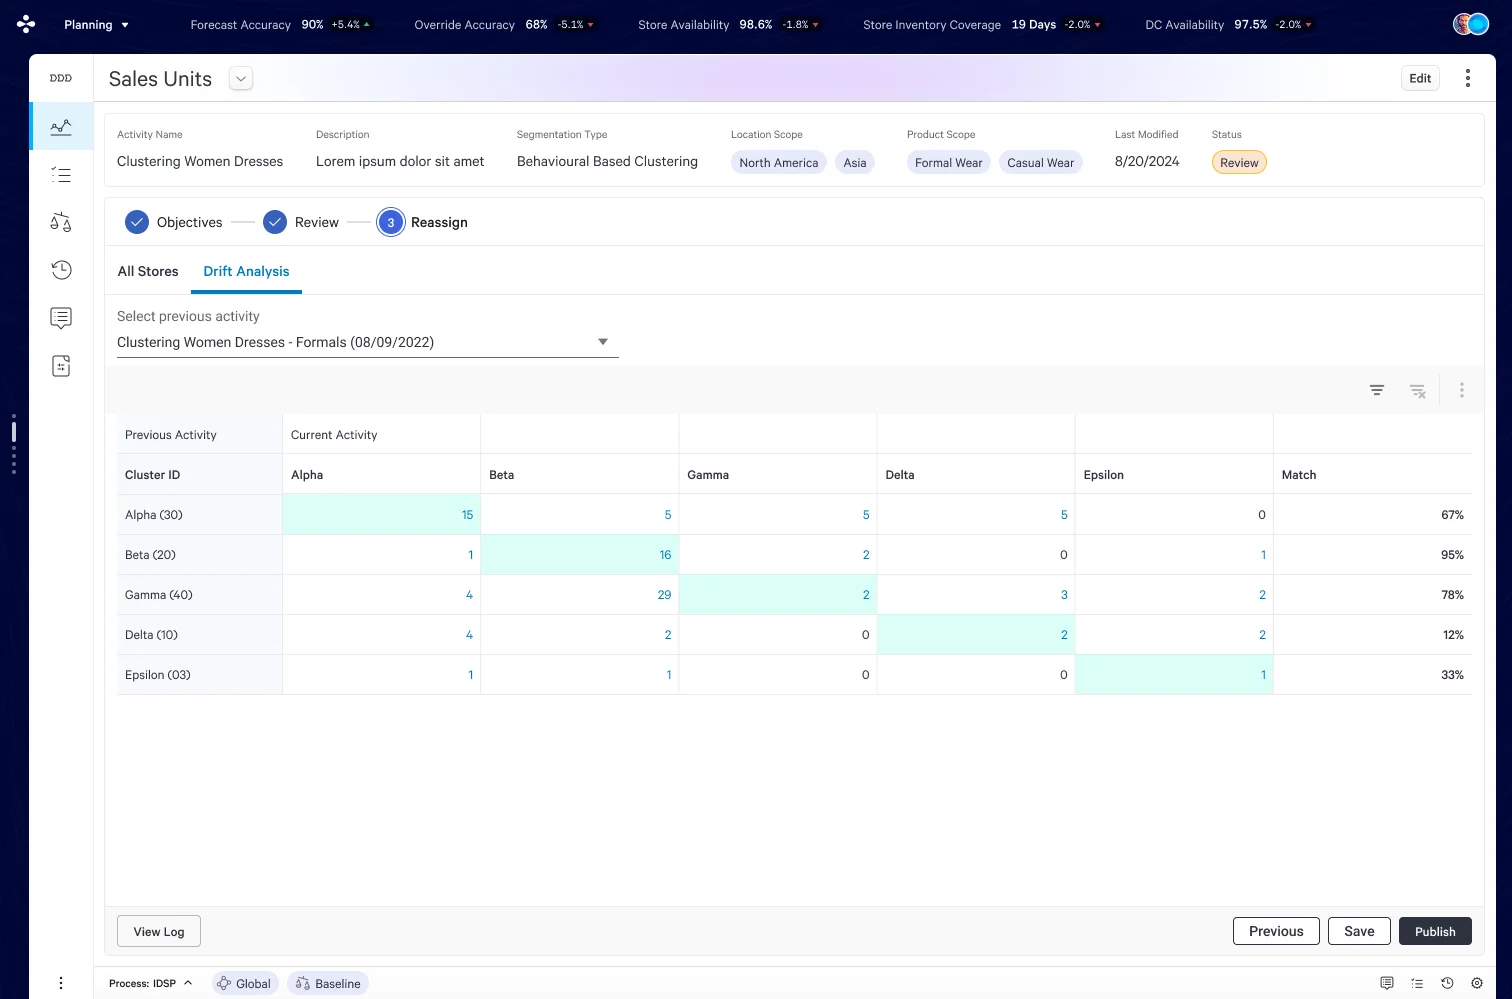
Manual reassignment is a first-class interaction — each store gets an independent dropdown for partial overrides. Drift Analysis contextualises results in time: 95% match on Beta signals stability, 12% on Delta signals a meaningful shift — each requiring a different business response.
05 — Design Decisions
Four calls that defined the experience.
3-tab actor configuration instead of a single long form
A single form would have required 12+ fields visible at once, creating cognitive overload for a feature most analysts configure once per quarter. Outcome: Reduced first-time completion errors; configuration is now self-guided.
Recommended flags on features rather than auto-selection
Auto-selection removes analyst agency and undermines trust in the model — especially critical in regulated retail environments where decisions have downstream financial impact. Outcome: Analysts engage more meaningfully with feature selection; recommendations are validated rather than bypassed.
Drift Analysis as a separate sub-tab, not an overlay
An overlay would layer comparison complexity on top of reassignment decisions — two cognitively distinct tasks. Outcome: Analysts now use drift analysis as a pre-reassignment signal rather than a post-hoc audit.
Cluster naming at template level, not at activity level
Naming clusters per-run creates inconsistency in reporting and handoff to downstream systems (assortment planning, replenishment); consistent names maintain semantic meaning across cycles. Outcome: Cross-activity reporting became tractable; stakeholder alignment on cluster definitions improved.
06 — Impact
What changed and what it meant.
The segmentation workflow shifted configuration from engineering-gated to analyst-owned, with measurable improvements in autonomy, adoption, and error reduction.
1
Session to configure
2
Product lines adopted
0
Silent publish failures
07 — Reflection
What I learned designing for algorithmic configuration.
What I Would Revisit
The feature significance scores surfaced in the Objectives step are powerful — but their source (the model's internal weighting algorithm) is invisible to the analyst. A future iteration would make the signal source transparent: showing what historical data window drove the recommendation, and whether that window is appropriate for the current activity's scope. Transparency at this layer is not just good UX — in enterprise environments where decisions affect inventory worth millions of dollars, it is a baseline expectation.
Where This Goes Next
The Drift Analysis view is the most underutilised feature in the current design. It has the foundation to become a continuous monitoring surface — tracking cluster stability over time, flagging when a store's behaviour has drifted enough to trigger a re-run recommendation automatically. Paired with the planning tool's existing forecast accuracy and DC availability metrics, this would close the loop between segmentation configuration and observable planning outcomes.
The Most Important Thing We Designed
Was not the wizard. It was the Review step — the moment when a system hands the analyst back control, and asks: do you agree?